How Big was 1999 Izmit Earthquake?


The 1999 Izmit earthquake in Turkey is one of the best recorded in the world but how large was it all around the world.

By Beste Saylar Nov 26 2021

word.png

izmit earthquake

How large was it?

The 1999 Izmit earthquake occured on 17 August 3.00am local time in northwestern Turkey.

  • The shock had a moment magnitude of 7.6

  • At least 17,118 people killed,

  • Nearly 50,000 injured,

  • Thousands missing,

  • About 500,000 people homeless.

Estimated 3 to 6.5 billion U.S. dollars damage in Istanbul, Kocaeli and Sakarya Provinces. Regarding to United States Geological Survey which is a scientific agency of the United States government where scientists study the landscape, natural resources and natural hazards that threaten it, the modified Mercalli Intencity scale indicates scale IX (nine) as violent. They define IX intensity as damage considerable in specially designed structures; well-designed frame structures thrown out of plumb. Damage is great in substantial buildings with partial collapse. Buildings are shifted off foundations. (source).

The severity of an Earthquake can be expressed in terms of both intensity and magnitude. However, the two terms are quite different;

Screen Shot 2020-11-26 at 2.12.17 PM.png

iZMIT EARTHQUAKE HAD SCALE IX AS VIOLENT

Intensity is based on the observed effects of ground shaking on people, buildings, and natural features. It varies from place to place within the disturbed region depending on the location of the observer with respect to the earthquake epicenter.

Magnitude is related to the amount of seismic energy released at the hypocenter of the earthquake. It is based on the amplitude of the earthquake waves recorded on instruments which have a common calibration. The magnitude of an earthquake is thus represented by a single, instrumentally determined value.

The initial awareness of overall extent and importanne of

An earthquake damage is investigated in two aspects; landslides and liquefaction. Izmit Earthquake is estimated to be significant in area exposed to hazard in both section and extensive in estimated population exposure meaning that the number of people living near areas that could have produced landslides and liquefaction in this earthquake is extensive.

LANDSLIDES: Landslides are commonly triggered by earthquakes in mountainous or hilly regions and can cause deaths, injuries, and damage.

LIQUEFACTION: Liquefaction is the loss of strength of loose, saturated soils caused by earthquake shaking that results in soil that behaves more like a liquid than a solid.

Geolocation of Izmit Earthquake - M 7.6 - western Turkey - 40.748°N 29.864°E

The geographical location of Izmit is between 40°-41° N and 29°-31° E, surrounded by the Gulf of Izmit at south, Istanbul and the Sea of Marmara at west, the Black Sea at north, and Sakarya at east.

The city is mostly built on hill slopes because of the cramped area, while flat plains surround the gulf, near the sea.

Izmit is geologically surrounded by water and mostly built in hill slopes. This makes this location vulnerable in both landslide and liquefaction factors. (souce)


I investigated my question about how large this earthquake was within the globe by getting data in two sections.

First, I’ve get a customized data of magnitude 7.6+ (the izmit earthquake’s magnitude rate), worldwide from August 17th 1999 (Izmit Earthquake date) to today.

Souce: Customized Data

RESULTS

fromAugust171999.png
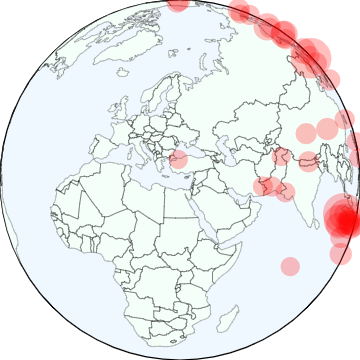
  • The result showed there has been 97 earthquakes total as much as big as Izmit Earthquake in 20 years.

  • Largest Earthquake happened with magnitude of 9.1 in 2011 called Great Tohoku Earthquake, Japan.

  • Turkey-Izmit earthquake is the 97th biggest earthquake from it’s time happened. 

Data in JSON format - link

Data in CSV format - embed

Observable - link

Map USGS -link

Second, I’ve get the data of the largest earthquakes in the world (as it’s been considered largest earthquakes are more than magnitude 7.0+), worldwide from August 17th 1999 (Izmit Earthquake date) to today.

Souce: Magnitude 7 +

RESULTS

largestEarthquakesWorld.png
  • The result showed there has been 1415 earthquakes total being considered as largest earthquakes in the world.

  • Largest  magnitude rate of 9.5 is Great Chilean Earthquake(Valdivia Earthquake) as being considered as extreme in year 1960.

  • Lowest magnitude rate of 7.0 is South of Alaska earthquake happened in 1901.

  • Newest large earthquake happened in year 2020/10/30 magnitude 7.0 in Néon Karlovásion, Greece

Data in JSON format - link

Data in CSV format - embed

Observable - link

Map USGS - link

Embed Block
Add an embed URL or code. Learn more

Than, I’ve put the Largest Earthquakes csv. file in Flourish Studio and put it to timeline where the first discovery of earthquake data from 1990 to today ant try to visualize the data through rate though month and gave the category of magnitude from 7.0 to 9.1 (largest ever discovered).

This visualization below shows the data visualization of the largest earthquakes happened from 1990 to today(2020) through rate/month.


OBSERVATION:


About this Story:

Historical analysis of earthquakes ever recorded from 1900’s and comparison of how large 1999 izmit Earthquake from the others.

For the analysis, I’ve used USGS data of largest earthquakes happened and USGS data of +7.6 magnitude earthquakes recorded after Izmit Earthquake.


COVID-19 DATA VISUALIZATION

For his week’s assignment I’ve made a data visualization using Flourish. The information I want to highlight is the Covid-19 comfirmed cases and death cases within the word in timeline from 1/22/2020 to present. My data is from John Hopkins Covid-19 Data Repository (Source: github link). After downloading the time_series I’ve uploaded my CSV file to Flourish Bar Chart data and specify columns and labels to visualize.

I'd would like to explore the difference number of cases between countries .

Death Cases over time in the World


Confirmed Cases over time in the World

My data was combined of Countries and Regions. The repetition of some of the countries in my visualization is the reason it gives different regions within that county. 

OBSERVATION:

  • Total of 171 countries effected by Covid19 right now.  

  • 53M confirmed case from Covid-19 around the world.

  • 1.3M death case from Covid-19 around the world.

From the graph, it is also possible to see cases per month and case numbers for each country separately.


PROCESS:

Confirmed cases

Confirmed cases

Death Cases

Death Cases

Confirmed Visual

Confirmed Visual

Death Visual

Death Visual

Finding Story through Data


For this week’s assignment I wanted to concentrate my previous visual story “The Rise of Burningman” from The Washington Post. I’ve collected my JSON data from GoogleTrends. 

Trends adjusts search data to make comparisons between terms easier. In my case my search term was “Burning Man Event”. For some of my questions, I’ve used “Coachella Valley Music and Art Festival”.  Each data point is divided by the total searches of the geography and time range it represents, to compare relative popularity.

The resulting numbers then get scaled on a range of 0 to 100 based on a topics proportion to all searches.

I’ve loaded my JSON data in to Observable and found these information about my story. 

Questions:

  • How did the popularity of burning man uprise over years?

  • Interest over time for Burning Man festival?

Google Trends

Google Trends

Observable (multiTimeLineBurning)

Observable (multiTimeLineBurning)

OBSERVATION :

It was interesting to see that I can not make a search earlier than 2014. Regarding to my question, I’ve come to solution that The Burning Man festival is more frequently searched in August which is the month of the event. The most popular event was the Burning Man 2014 regarding to the search queries. Overall, it is evenly distributed over the years.

Here is a link of my Observable;

Popularity over years


  • Top Burning Man Subjects related search queries?

  • What did people search more about Burning Man?

Google Trends

Google Trends

Observable(relatedEntities)

Observable(relatedEntities)

OBSERVATION :

It was interesting to see people search more of a specific Burning Man event with years. Regarding to my data, people have searched queries like;

Tent, Black Rock Desert, Flume, Principle, Art Car, Sculpture, Reno, Nevada, Cost.. Which mostly represent the location of event and some of them were the needs of event attendees.

It was sad to have not much of a data on this one. My total data length was 12.

Here is a link of my Observable;

Related Entities


  • Burning Man popularity compared to Coachella?

Screen Shot 2020-11-04 at 1.55.04 PM.png
Observable(multiTimeline)

Observable(multiTimeline)

OBSERVATION :

It was interesting to see that Coachella Valley Music and Art Festival has been searched much more than Burning Man over the years. Regarding to my question, I’ve come to solution that Coachella is more popular than Burning man. They both searched in the month of the event where we can see Burning man in on August whereas Coachella event in April. Overall, whereas Burnin Man festival is evenly distributed over the years, Coachella festival increased it’s popularity starting from 2009.

Here is a link of my Observable;

Burning Man VS Coachella

  • Interest for Burning Man depending on Subregion in USA.

Google Trends

Google Trends

Observable(geoMap)

Observable(geoMap)

OBSERVATION :

Burning Man was being searched more likely in Nevada with 100 scale where the festival is taking place. After that, it has been searched in the below subregions respectively;

-California, Oregon, Washington, Colorado, Utah, Idaho, Montana….

We can say that Burning Man is mostly searched in it’s surrounding areas.

Here is a link of my Observable;

Subregional Search

VISUAL STORIES

article #1:

The words that hadn’t been said in a State of the Union until Trump said them - The Washington Post

Data Source:

Historical speech transcripts from the American Presidency Project. 2018 State of the Union transcript from White House press office. 2019 and 2020 transcripts from the Federal Document Clearing House. Some historical “joint addresses” were delivered as a written message, not a speech.

For their analysis, they identified words that shared the same root using a stemmer implementation from NaturalNode. There are some transcription errors and the stemming algorithm is imperfect, so it’s possible (likely, even!) that there are previously unused words that we’ve missed.

Originally published Jan. 30, 2018.

  • American Presidency Project : The American Presidency Project, non-profit and non-partisan, is the source of presidential documents on the internet.  We are hosted at the University of California, Santa Barbara.

  • Federal Document Clearing House: The Federal Audit Clearinghouse (FAC) operates on behalf of the Office of Management and Budget (OMB). Its primary purposes are to:

    • Distribute single audit reporting packages to federal agencies.

    • Support OMB oversight and assessment of federal award audit requirements.

    • Maintain a public database of completed audits.

    • Help auditors and auditees minimize the reporting burden of complying with Single Audit requirements.

  • NaturalNode: "Natural" is a general natural language facility for nodejs. Tokenizing, stemming, classification, phonetics, tf-idf, WordNet, string similarity, and some inflections are currently supported. (Github)

Data visualization:

Screen Shot 2020-10-30 at 12.10.44 PM.png

VISUAL:

Headline:

Screen Shot 2020-10-30 at 12.22.10 PM.png

SUB-HEADLINE:

Byline, pub time:

Screen Shot 2020-10-30 at 12.25.07 PM.png

GRAPHIC, TEXT:

sOURCE, METHODOLOGY:

Screen Shot 2020-10-30 at 12.27.10 PM.png

Storytelling:

Every president adds some new words to the presidential lexicon. Graphics show the “new words” used for the past 28 presidential addresses under Trump, Barack Obama, George W. Bush and Bill Clinton.


article #2: THE RISE OF BURNING MAN- THE WASHINGTON POST

Data Source:

Satellite imagery of Black Rock City from DigitalGlobe and ESA Sentinel. Demographic data collected and distributed by the Black Rock City Census. Data for regional Burning Man groups from the Burning Man Regional Network. Population data from the Burning Man timeline. Burner photos provided by individuals. Mushroom illustrations based on “Shrumen Lumen” by the FoldHaus art collective.

  • Maxar Technologies: delivers disruptive Earth Intelligence and Space Infrastructure capabilities. Helping customers better understand our changing planet and unlock the potential of space. Providing A Better World. Geospatial Data. Advanced Space Technology. Company specialize in manufacturing communication, Earth observation, radar, and on-orbit servicing satellites, satellite products, and related services. (Maxar)

  • Digital Globe: A satellite imagery company, highlight the build-up and teardown of Black Rock City, Nevada, over several weeks in 2017, leaving the desert just as it was, with no trace of the huge confab.

  • Black Rock City Census: The Census is one of the primary ways the Burning Man organization tracks changes in population, behavior, and attitudes of event participants. The more we understand the makeup of Black Rock City and the diverse kinds of Burning Man experiences, the better equipped we are to meet the needs of the community and help Burning Man culture continue to flourish. (Census)

  • Burning Man Regional Network: The Burning Man Regional Network plays a key role in the year-round extension of the Burning Man experience, supporting it as a global cultural movement. In cities around the world, Regional Contacts help local Burners connect with each other, while bringing Burning Man principles and culture into their local communities through events and activities, year-round. (The Network)

  • FoldHaus: FoldHaus is a collective of engineers, designers, and makers based in the San Francisco Bay area, that is dedicated to creating interactive kinetic art.

  • Burning Man Timeline: Credits for demographic Data

DATA VISUALIZATION:

VISUAL

Screen Shot 2020-10-30 at 1.24.43 PM.png

headline:

THE RISE OF BURNING MAN

Sub-headline:

From a huddle of hippies on a beach to a city of 70,000 in the desert, here’s how a festival became a lifestyle.

GRAPHIC, TEXT:

Screen Shot 2020-10-30 at 1.29.36 PM.png

Source, Methodology:

BYLINE-PUB TIME:

By Lauren Tierney and Shelly Tan Aug. 23, 2018

STORYTELLING

Beginning of the culture event, location, the racial diversity, regional and age distribution, income statistics of Burning Man including interviews.