
Utility Company Dashboard Study Case

Case :
A local utility company (electric and gas) gets calls, emails, and letters from residents that report small maintenance issues (e.g. loose electric wires, a gas valve that keeps leaking, broken meter, replacement of a plug, etc.) that are not utility outages. The utility company has a dedicated staff responsible for maintenance of residential issues. There is not always an easy way for residents to report problems so they can be resolved quickly. The utility company has decided to build a web application so residents can report issues and track their resolutions.

I approach the problem with questions like;
Why the problem exist?
Why is it not easy to report problems?
For the process of collecting data information, I’ve used Primary, Qualitative and Generative research methods. When discovering my problem, I’ve used market research, behavior observation and user interviews as research techniques. I’ve tried to understand what is the current usage of the service. Watched human behavior while using the current service and I’ve learned what not to do I’ve also made research on what are the existing standards in other utility companies in Us(like, new jersey’s PSEG and Puget Sound Energy)


After synthesizing the research and findings, I’ve started creating my persona to identify my user. I’ve assumed the case is taking place in New York. New York is a fast paced city. Everybody tend to be in rush all the time and they don’t wanna spend too much time reporting neither registering for a service.
PERSONA

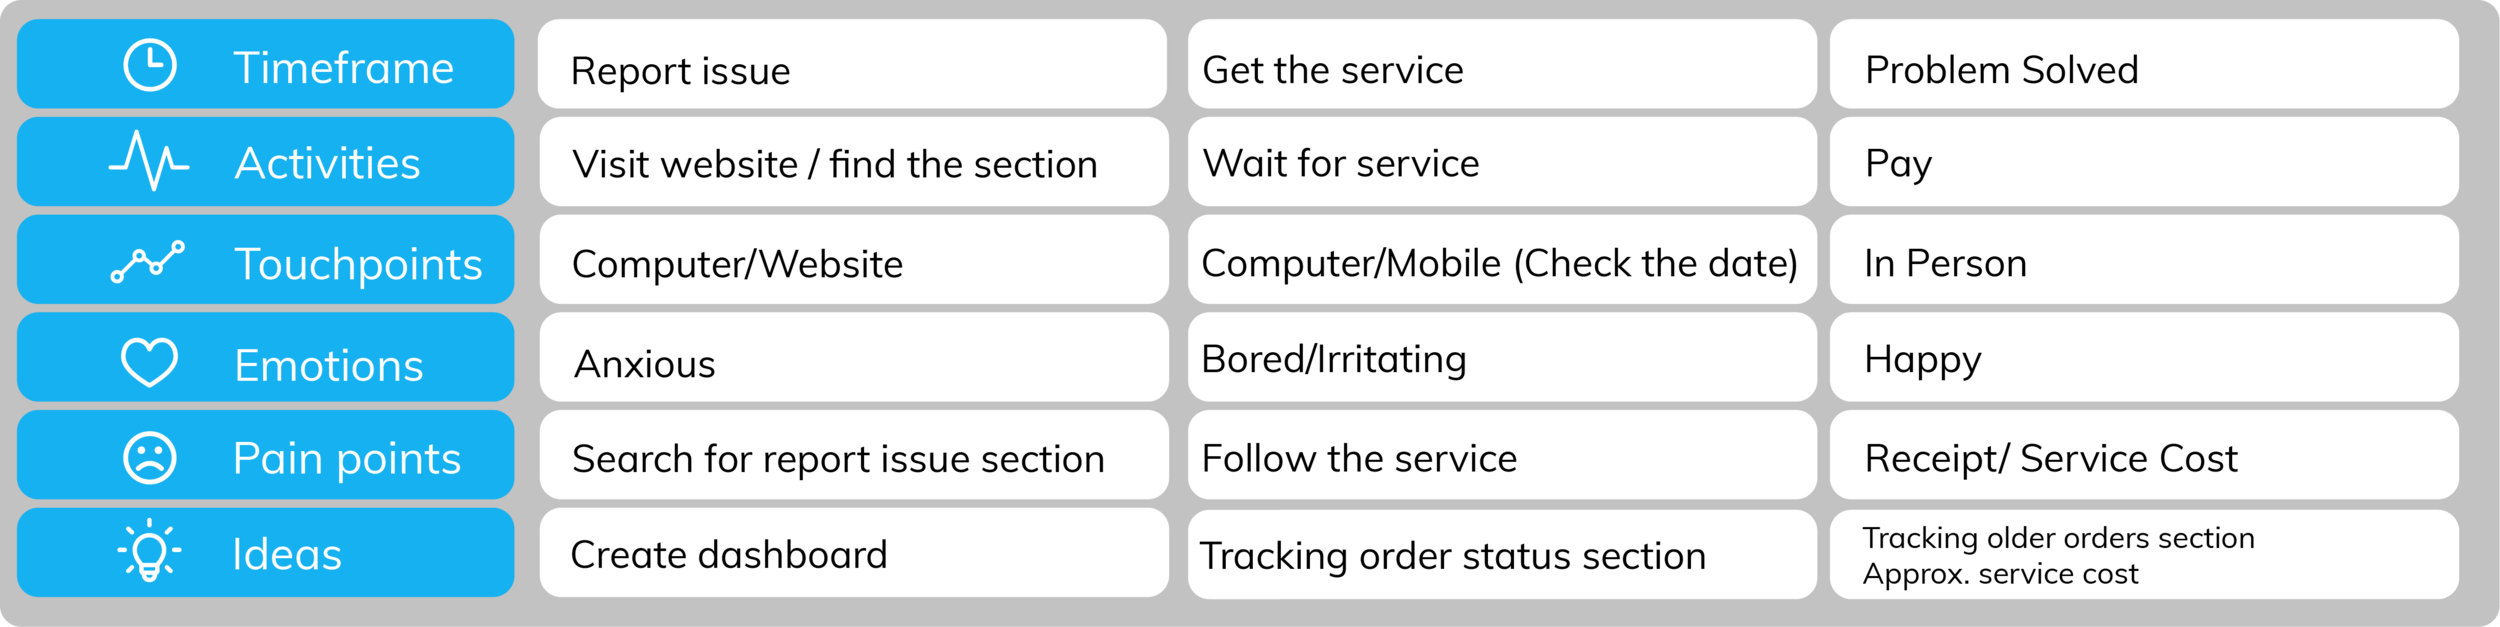
USER JOURNEY MAP
To create a detailed mapping I tried to understand, general human behavior and experience.
As you can see, on top. I’ve the timeframe. This represent the key moments and the life cycle of the experience. I paid attention how does each phrase last in hours or days. Than, you’ll see key activities of to the experience, this leads me understand the patterns of the activities. Touchpoints; help me understand what are the users interacting with(apps, in person, phone call, online) Emotions, help me understand how does the user feel at each point and lastly and the most importantly I’ve come up with the painpoints.
By doing it, I’ve asked myself these questions…
What are the moments of friction?
What is frustrating or missing?

LO-FI WIREFLOW

WIREFRAME DASHBOARD